s29.q4cdn.com
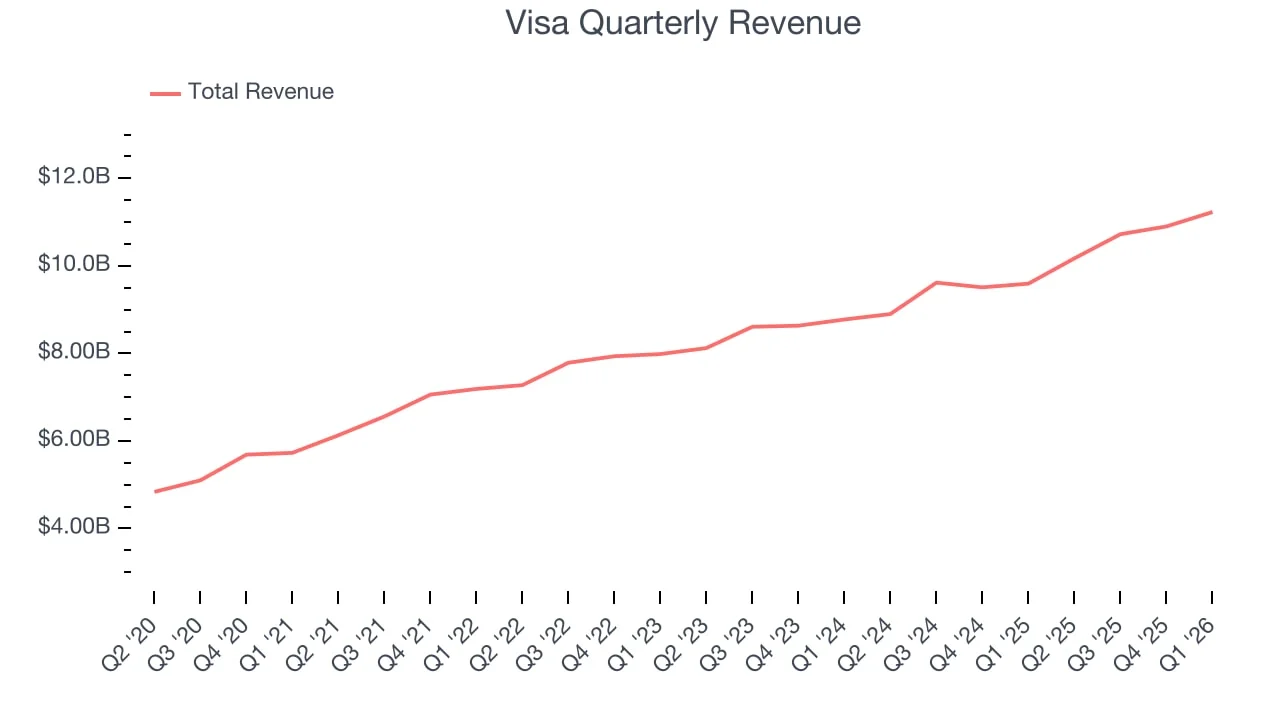
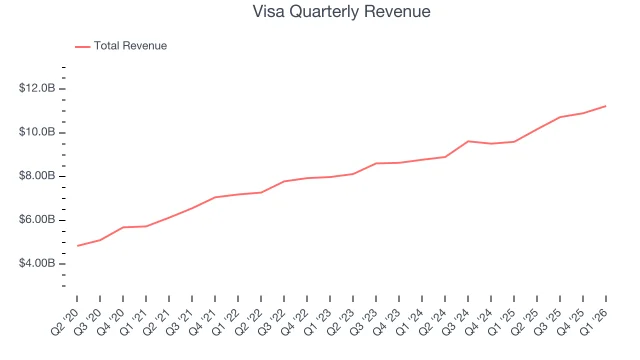
Visa Fiscal Year 2024 Annual Report
Full financial statements, revenue breakdown, and management discussion for Visa's FY2024.
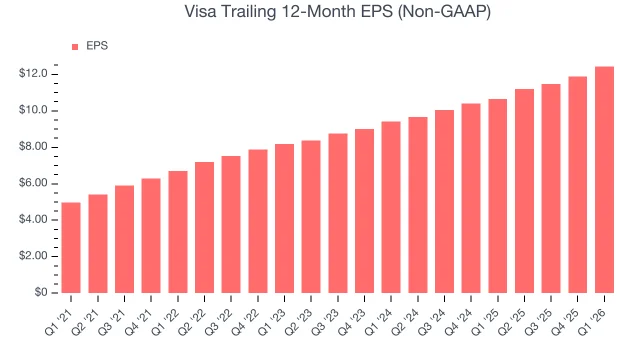
Visa clears all three screens—3-year trailing ROE ~48.8%, free cash flow above $17B every year since 2022, and a forward P/E of ~23.7× sitting ~12% below its own historical average. The main caveat is the DOJ debit-monopoly suit, which created the discount and whose resolution is the key asymmetry to track.

| Criterion | Data | Result |
|---|---|---|
| 3-year trailing ROE > 15% | FY2022: ~40% → FY2023: ~43% → FY2024: ~51%; 3-yr avg ~48.8% | ✅ |
| Positive free cash flow | FY2022: $17.9B · FY2023: $19.7B · FY2024: $18.7B | ✅ |
| Reasonable valuation | Forward P/E ~23.7x vs. 5-yr historical avg. of ~28–32x | ✅ |
| Metric | Visa (V) | Mastercard (MA) | Note |
|---|---|---|---|
| Trailing P/E | ~29x | ~33x | MA runs at a premium |
| Forward P/E | ~23.7x | ~27x | V at a ~12% discount to 5-yr avg |
| Price/FCF | ~29.8x | ~32–34x | MA FCF base is smaller ($13.6B) |
| Dividend yield | 0.67% | 0.54% | Neither is an income play |
| 10-yr total return | +474% | +573% | MA outperformed on share price |
Full financial statements, revenue breakdown, and management discussion for Visa's FY2024.
围绕这条内容继续补充观点或上下文。